Green Turtle Habitat Selection and Movement Patterns
Ecological niches and habitat selection
This research has been published in the Open Access journal Ecosphere following peer review (https://doi.org/10.1002/ecs2.70136).
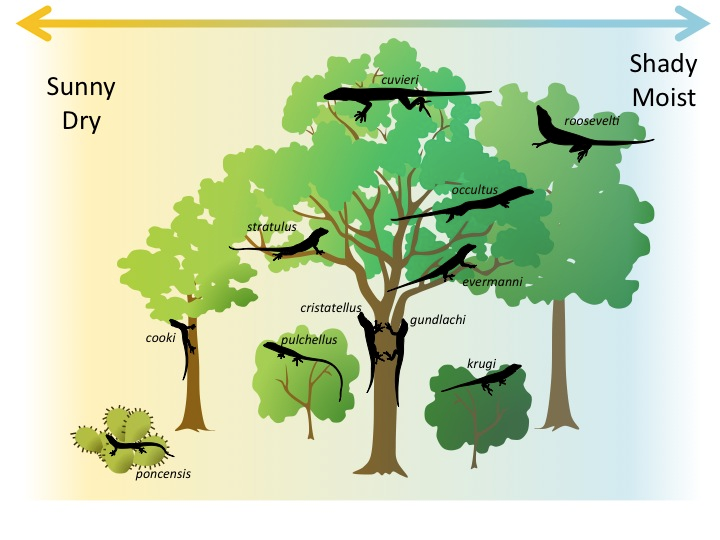
Characterizing the distributions of animals over space and time is fundamental to the field of ecology, especially to understand relationships with biotic (e.g., predators, prey) and abiotic (e.g., temperature, water depth, wind speed) variables (Leibold, 1995). This includes topics related to which species can be found together in the same areas (Chase, 2003; Saito et al., 2021), the spread and persistence of invasive species (Latimer et al., 2009; Peterson, 2003), as well as the factors that influence a species’ ecological niche (Hutchinson, 1957; Matthiopoulos et al., 2023). The ecological niche is comprised of all resources (biotic and abiotic) that represent how an animal interacts with its environment, but is commonly studied from the perspective of habitat use and food web interactions.
While there are a variety of ways in which researchers have studied the ecological niches of fish, wildlife, and plants (such as stomach contents, natural biochemical tracers, surveys of animal occurrences), this study used a large dataset of animal tracking data collected with satellite tags. These satellite tags were deployed on 99 green sea turtles (Chelonia mydas) that were captured and released at three distant regions: the Gulf of Mexico, Brazil (Southwest Atlantic), and Qatar (Arabian Gulf).

With this tracking dataset, we evaluated the ecological niche of of green turtles by estimating habitat selection, which measures how an animal selects certain habitats compared to what was available to the animal. When performed across a large dataset of tagged green turtles, we can gain insight into what habitats they prefer and potentially use this information for conservation purposes, such as the creation or expansion of protected areas. Additionally, if the statistical models developed are accurate at making predictions beyond the region where animals were tracked, we can potentially use this model to generate further predictions outside of the study area. The use of these (transferable) models may be important for making predictions in regions that have little to no data collected, for forecasting potential areas that may be unsuitable/suitable in the future under climate change impacts, as well as to predict the potential expansion or establishment of invasive species.
Sea turtle life history
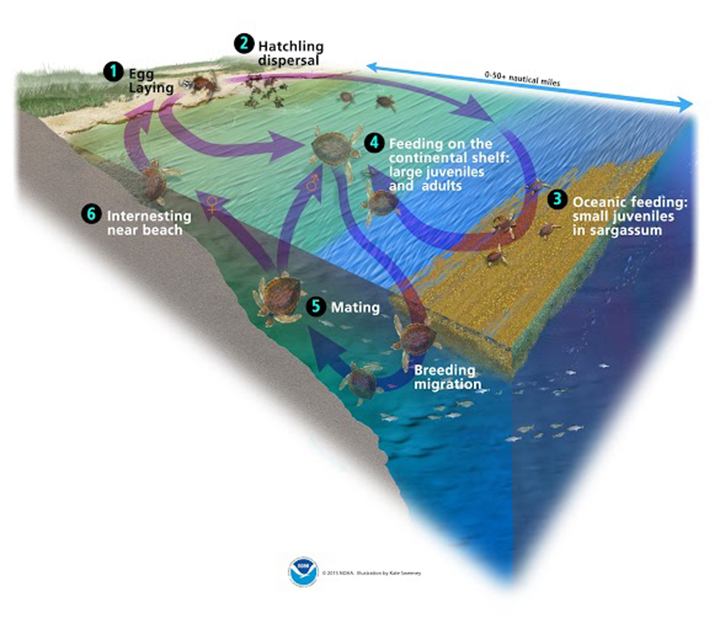
There are seven species of sea turtles worldwide, all of which have complex life cycles where they remain connected to both the land and ocean. While there are some differences by species and location, hatchlings initially emerge from the nesting beach and then make their way to the water to begin their oceanic phase where they remain in the open ocean for a few years before returning to nearshore developmental habitats as juveniles. Juvenile turtles typically remain at these sites for potentially years at a time while they grow before maturing into reproductive adults. Adults may travel over 1000 miles (1600 km) from foraging to breeding sites, where females will then remain before laying several clutches of eggs over the span of a few weeks before returning to foraging grounds. These highly migratory species are therefore at risk to a number of anthropogenic (human-caused) threats, including habitat degradation, risk of bycatch from commercial fishing, boat strikes, and coastal pollution, among others.
Green turtles follow the life cycle pattern described above, where they feed on primarily animal prey during their oceanic phase and then transition to an herbivorous diet upon settling in coastal developmental habitats as juveniles. As they continue to grow larger, green turtles often consume seagrasses and algae growing from the seafloor. This set of dietary preferences places great importance on seagrass meadows for this species, not to mention the large number of other coastal species that rely on seagrasses for food and shelter.
Relating green turtle movements to environmental factors
Below is an interactive map that allows you to explore the observed locations of juvenile and adult green turtles with respect to the three variables that were considered by this study as important drivers of green turtle occurrence: water depth, sea surface temperature (SST), and net primary productivity (NPP; a proxy for plant biomass). These maps are shown for each of the three study regions: Gulf of Mexico, Brazil, and Qatar. This interactive map can also be found at https://joshcullen.shinyapps.io/green_turtle_tracks/. This study was conducted in collaboration with Mariana Fuentes (Florida State University), Armando Santos (Florida State University), Christopher Marshall (Texas A&M University), Margaret Lamont (USGS), Christopher Sasso (NOAA), Camila Domit (Universidade Federal Do Paraná), and Mehsin Al Ansi (Qatar University).
Spatial predictions of green turtle density
Based on a transferable species distribution model I developed as part of an NSF-funded project, predictions of relative green turtle density are shown below for each of the three study regions. Values of depth, SST, and NPP are used to generate these predictions on a monthly basis. Code for generating these spatial predictions can be found here. Predictions in below maps are shown for June 2026.
Northwest Atlantic
Southwest Atlantic
Arabian Gulf
This material is based upon work supported by the National Science Foundation under Grant Number 2126583. Any opinions, findings, and conclusions or recommendations expressed in this material are those of the author(s) and do not necessarily reflect the views of the National Science Foundation.
References
Bear, R., Rintoul, D., Snyder, B., Smith-Caldas, M., Herren, C., & Horne, E. (2022). Principles of Biology. OpenStax CNX. http://cnx.org/contents/db89c8f8-a27c-4685-ad2a-19d11a2a7e2e@24.18.
Chase, J. M. (2003). Community assembly: when should history matter?. Oecologia, 136, 489-498.
Hutchinson, G. E. (1957). 1957: Concluding remarks, Cold Spring Harbor Symposium on Quantitative Biology 22, 415-27.
Latimer, A. M., Banerjee, S., Sang Jr, H., Mosher, E. S., & Silander Jr, J. A. (2009). Hierarchical models facilitate spatial analysis of large data sets: a case study on invasive plant species in the northeastern United States. Ecology Letters, 12(2), 144-154.
Leibold, M. A. (1995). The niche concept revisited: mechanistic models and community context. Ecology, 76(5), 1371-1382.
Matthiopoulos, J., Fieberg, J. R., & Aarts, G. (2023). Species-Habitat Associations: Spatial data, predictive models, and ecological insights, 2nd Edition. University of Minnesota Libraries Publishing. Retrieved from the University of Minnesota Digital Conservancy, https://hdl.handle.net/11299/217469.
Peterson, A. T. (2003). Predicting the geography of species’ invasions via ecological niche modeling. The Quarterly Review of Biology, 78(4), 419-433.
Saito, V. S., Perkins, D. M., & Kratina, P. (2021). A metabolic perspective of stochastic community assembly. Trends in Ecology & Evolution, 36(4), 280-283.
Williams, E. E. (1983). Ecomorphs, faunas, island size, and diverse end points in island radiations of Anolis. In Lizard Ecology: Studies of a Model Organism (pp. 326-370). Harvard University Press.